There are many different sales reports available to from Reports | Sales Reports; each with their own methods of gathering and grouping the data. The various reports include:
 Figure 12-5 Figure 12-5
| - Employee
- Department
- Style
- Sales Summary
- Vendor
- Item
- Profit Report
- Sales Journal
|
The order in which the report samples are presented below has been changed to optimize the image sizes for this guide.
Sales Report Samples
The next section will go over the information available in each report, and give you image samples. Wherever possible, the Detail reports (as opposed to Summary) were used.
Employee Report - Lists all sales within the date range specified, grouped by Clerk ID.
- Includes the following fields:
- SKU, Description, Revenue, Cost, Quantity, Clerk ID.
- Displays subtotal by Clerk ID, and grand total for each of the Revenue, Cost and Quantity fields.
 Figure 12-6 Figure 12-6
|
Department Sales Report - Lists all sales within the date range specified, grouped by department.
- Allows you to filter results by a range of department codes.
- Includes the following fields:
- SKU, Description, Quantity, Revenue, Percent of Revenue, Cost, Margin, Markup, Gross Profit, Department.
- Displays subtotals by department, and grand total for each of the numeric fields.
 Figure 12-7 Figure 12-7
|
Style Sales Report - Lists all sales within the date range specified, grouped by style.
- Allows you to filter results by a range of style codes.
- Includes the following fields:
- SKU, Description, Quantity, Revenue, Percent of Revenue, Cost, Margin, Markup, Gross Profit.
- Displays subtotal by style, and grand total for each of the numeric fields.
 Figure 12-8 Figure 12-8
|
Sales Summary Report - Lists sales totals within the date range specified, grouped by date.
- Includes the following fields:
- Date, Site, Sales, Tax, Tax2, Total, Cost of Goods Sold, Office Payouts, Other Payouts, Number of Receipts, Gross Profits, Gross Profit Percentage.
- Also includes grand totals for these figures, along with invoice counts and invoice averages.
 Figure 12-9 Figure 12-9
|
Item Sales Report - Lists sales, grouped by item.
- Can be generated for a single SKU by date range or for all SKUs by department.
- Can also be used to create mailing labels by items purchased within a date range.
- Single SKU report includes the following fields:
- Site, Date, Invoice Number, Customer, Description, Price, Quantity, Discount, Totals.
- Also lists the averages for each of the numeric fields.
 Figure 12-10 Figure 12-10
|
Profit Report - Lists all sales by SKU, grouped by month.
- Allows you to sort by SKU or description.
- Allows you to group by department, if desired.
- Includes the following fields:
- SKU, Description, Units Sold by Month, Total Units Sold, Sales, Profit, Percent of Margin.
- Also displays grand totals for Quantity, Sales, Profit, Percent of Margin.
 Figure 12-11 Figure 12-11
|
Sales Journal Report - Lists all sales within the date range specified, grouped by invoice number.
- Includes the following fields:
- Date, Invoice Number, Customer, Amount, Tax, Total, How Paid.
- Also displays grand totals for Amount, Tax, Total.
 Figure 12-12 Figure 12-12
|
Vendor Sales Report - Lists all sales within the date range specified, grouped by vendor.
- Allows you to filter results by a range of vendor codes.
- Includes the following fields:
- SKU, Description, Quantity, Revenue, Percent of Revenue, Cost, Margin, Markup, Gross Profit, Vendor.
- Displays subtotal by vendor, and grand total for each of the numeric fields.

|
Figure 12-13
Cost of Goods Display
Gives you a concise display of the retail value and cost of your current inventory on hand.

Figure 12-20
Slow/Fast Moving Products
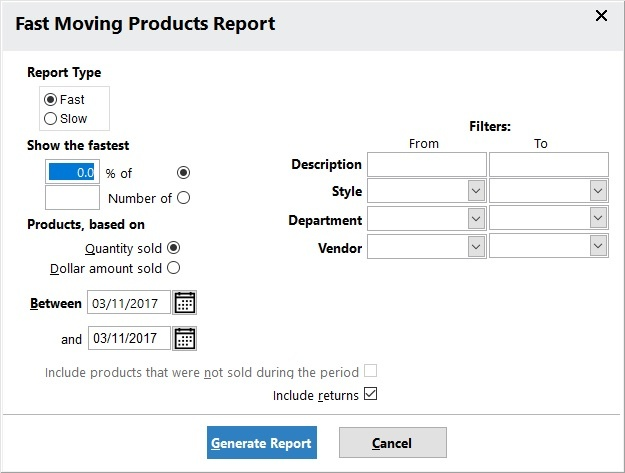
Figure 12-21
This report will assist you with finding out which products sold the most or least within a given date range, based on many customizable settings.
- Report Type - Defines the Fast Moving or Slow Moving Report
- Show the fastest/slowest –Defines the number of items reported on.
- Choose "% of" and enter a percentage
- Choose "Number of" and enter the exact number of items you are looking for.
- Products based on – Allows you to search by quantity or revenue based on sales.
- Between – Defines the date range for which you will be searching.
- Include products...not sold – Allows you to include unsold items in your report.
- Include returns – If disabled, returns will not be considered when calculating sales figures for this report.
- Filters – Allows you to set filters to restrict search results.
- Generate Report – Click here to generate the report based on your settings.
- Cancel – Click here to close the Slow/Fast Moving Products Report window.

Figure 12-22a
Sales Graphs
MicroBiz provides you with several graphical reports under this menu.

Figure 12-23
- Sales by Department – Compares sales by department for a given date range.
- Quarter-to-Date Sales – Creates bar graph displaying sales/margins by department.
- Sales/Profits by Employee – Compares sales/profits by employee for a given date range.
- Sales/Margins by Month – Graphs sales and margins by month for a given date range.
- Last 12 Months Sales – Displays sales and margins by month for the last 12 months.
- Sales/Profits by Source – Creates a two-form report in spreadsheet form displaying sales and profit by source (how heard).
- New Sales Graphs – Opens the graphical report viewer, which can be customized to quickly view and customize several different sales graphs.